Scientific graphing and analysis for research-focused users
SigmaPlot, developed by Systat, is a Windows scientific graphing and analysis package for researchers and engineers. It creates publication-quality visuals and supports detailed statistical interpretation through guided interfaces and a curve-fitting engine. The tool integrates with common lab workflows, handles large datasets, and provides export formats suited to journal figures. It targets academic researchers, laboratory scientists, medical professionals, and engineers who need precise visual control and reproducible analysis.
Top Recommended Alternative
What the software does in research workflows
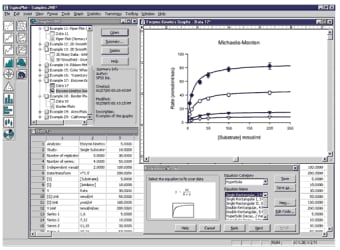
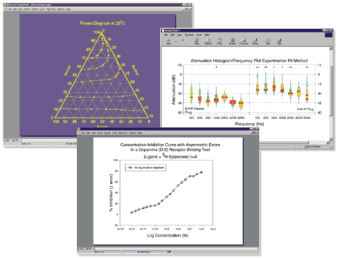
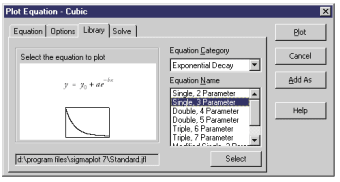
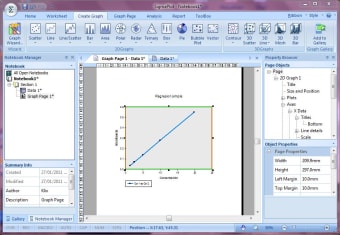
The software is a Windows scientific plotting and analysis package tailored to technical graph production and statistical evaluation. It supports over 100 distinct 2D and 3D plot types and a Global Curve Fitting engine with more than 155 built-in functions. Worksheets can hold very large tables, as the product supports up to 32 million rows and 32,000 columns, which suits empirical projects with substantial raw data.
How it helps learners practice data analysis
The Regression Wizard and the SigmaStat advisor present model choices, test recommendations, and fit diagnostics step by step so learners can inspect numerical outputs and residual plots. That structure helps students translate abstract statistics into concrete decisions during exercises in hypothesis testing or model fitting. Instructors can save analysis sessions as project files so learners reproduce an instructor's workflow from a recorded starting point.
Is it appropriate for classroom use or self-study?
The package is aimed at academic researchers, laboratory scientists, medical professionals, and engineers who have some statistical background and need detailed control. It runs on Windows 10 and 11 and requires at least 4GB of RAM, with 8GB recommended for large datasets. The interface can feel dated to some users, and some have reported challenges with licensing and installation, which suggests instructor setup time for class deployment.
How results are recorded and shared for assessment
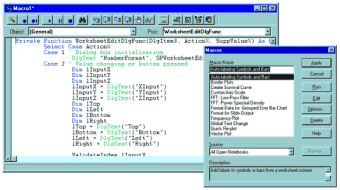
Export options include TIFF, EPS, PDF, and EMF formats suitable for figures in reports, and worksheets can be saved alongside graphs for submission. The macro recorder and a Visual Basic-compatible transform language let educators capture exact steps and produce reusable scripts, making it possible to compare student outputs against a saved reference. These capabilities support transparent assessment of analytic work in labs and coursework.
Who benefits and what to prepare
The software is a pragmatic option for advanced learners and educators in research labs who require precise visual control and rigorous analysis. The interface can feel dated and some users report challenges with licensing and installation, so plan instructor setup time. Practical tip: assemble reusable project skeletons and sample datasets to shorten student onboarding. The tool suits teams able to invest time in reproducible workflows.